
Not a whole lot has changed for MNQZ23 since November 18, and we have yet to take out the pivot high at 16258.75. The November 18 projection for the new high is still the same at 18213.25, and the projected pattern low is still the same as it was calculated on November 5, that is, 9698. The video is much shorter than normal this week, as I covered the ground I discussed previously. On a weekly and daily basis, MNQZ23 does appear to be a bit overbought but still might have some momentum left to run for new highs. Monthly analysis begins at 0:00, weekly analysis begins at 2:41, and daily analysis begins at 4:27.
Which way will MNQZ23 eventually go? I have no clue.
You can go to almost any post I have made in the last couple of weeks, and the majority of the mainstream analysts think the Fed will do at least four interest rate cuts next year and that stocks will once again rally. That could happen, However, some scary stuff confronts this market.
If you will remember a few weeks back when I commented on the Federal Reserve’s reverse repo facility and the fact that it was very likely to run dry in 6 months or so. Well, on Friday, This chart was released, and indeed an early 2024 projection would appear to put this fund at zero. That would put pressure on 6-month U.S. Treasury bills under pressure to rise and for that rise to permeate other duration levels of U.S. Treasuries. No fun for business borrowing, no fun for mortgage rates, and no fun for consumer prices over time.
When you realize that U.S. stock valuations are at all-time extremes when compared to foreign equities as shown here:
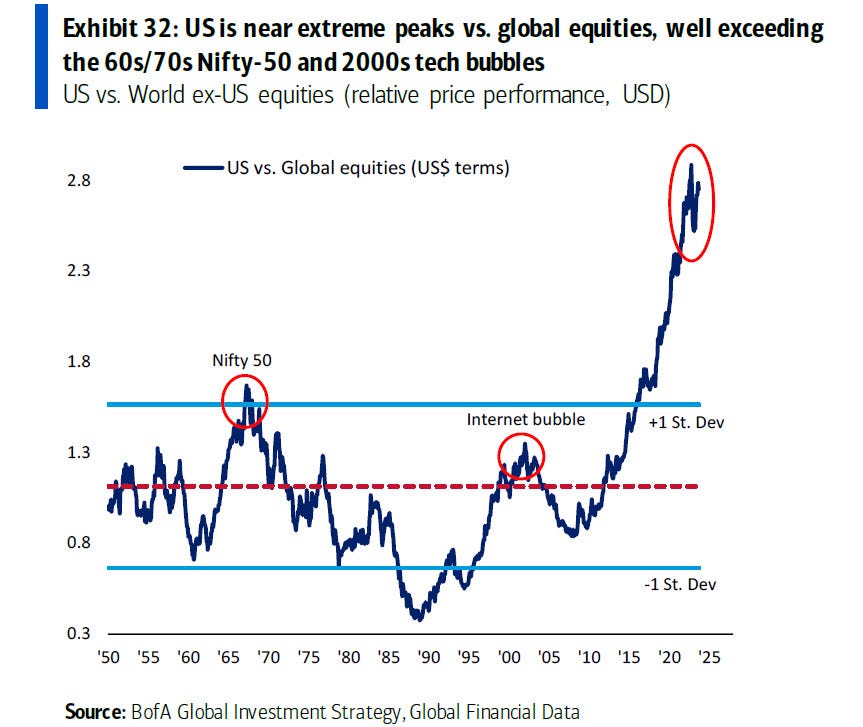
According to Dr. John Hussman’s and others’ research about long-term returns from U.S. equities over the next 12 years, the total returns are turning negative, as the valuations are insanely high given the current yield environment and the prospects of inflation. Markets would have to correct substantially for returns expected by investors of 10% per annum. To read this link and subsequent links tied to this chart, click here. For a 10% annualized rate of return to existing going forward in time, the $SPX could be expected to correct to somewhere around 2400 if those projections are accurate.
Let’s not forget that credit is tightening for consumers as their savings run dry and that interest payments are now swamping the Federal budget, threatening military spending and entitlements spending. To the person who was asking if bond vigilantes are coming or not, the Fed through its repo facility might just perform harakiri and by insane printing in conjunction with no spending cap for at least another 13 months. No vigilantes are required, the nob on the chaos machine is already turned to 11.
Markets can continue until the mania drones on and the easy money stays in circulation. Odds are getting stronger each day that the party will end as everything continues to get higher rates get even higher and the money supply tightens. I think I have said this before, runaway spending without caps and the endless printing of money is not sustainable for once really healthy and now somewhat damaged economies. I could go further on this topic, but I will not for now. I am prepared to trade in either direction as the need arises. I don’t care either way as I can adjust and be long or short no matter what happens. If you are long-only however, you need to consider valuations and future holding of assets you need for retirement. It is not time to emote however, it is TIME TO THINK!
Instead of leaving on a potentially fearful or dour note, we need to hear some exhilarating music. Listen to Ellen Williams's cover of the Sarah Brightman hit, “Time To Say Goodbye”. The voice of an angel will be experienced.
That is all for me today. Have a great rest of the weekend!
Share this post